Compass is a cutting edge, dynamic quant screening tool which analyses millions of data points, allowing users to make assessments on Momentum, Quality and Valuation.
Compass provides exclusive access to the proprietary products of the Mirabaud Wealth Management team.

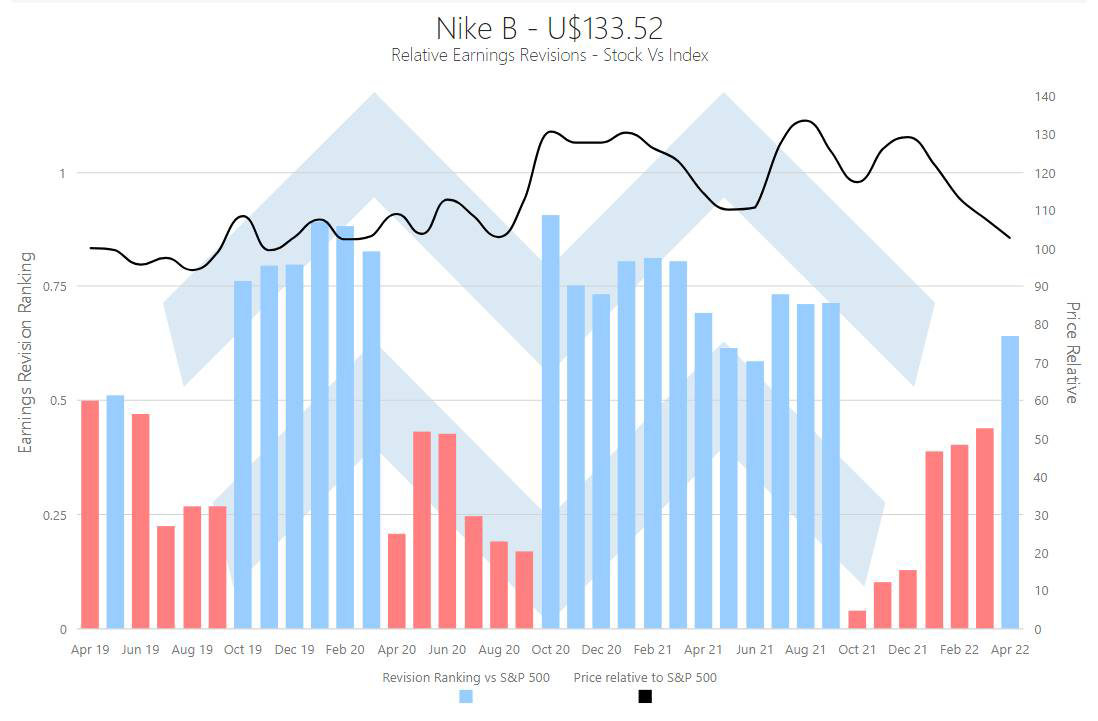
Screen for changing trends in earnings momentum for individual stocks, portfolios or entire indices, benchmarking against multiple global indices.
Through the email alert service, users can be automatically notified of changing earnings momentum in custom portfolios – helping to spot opportunities / avoid profit warnings.

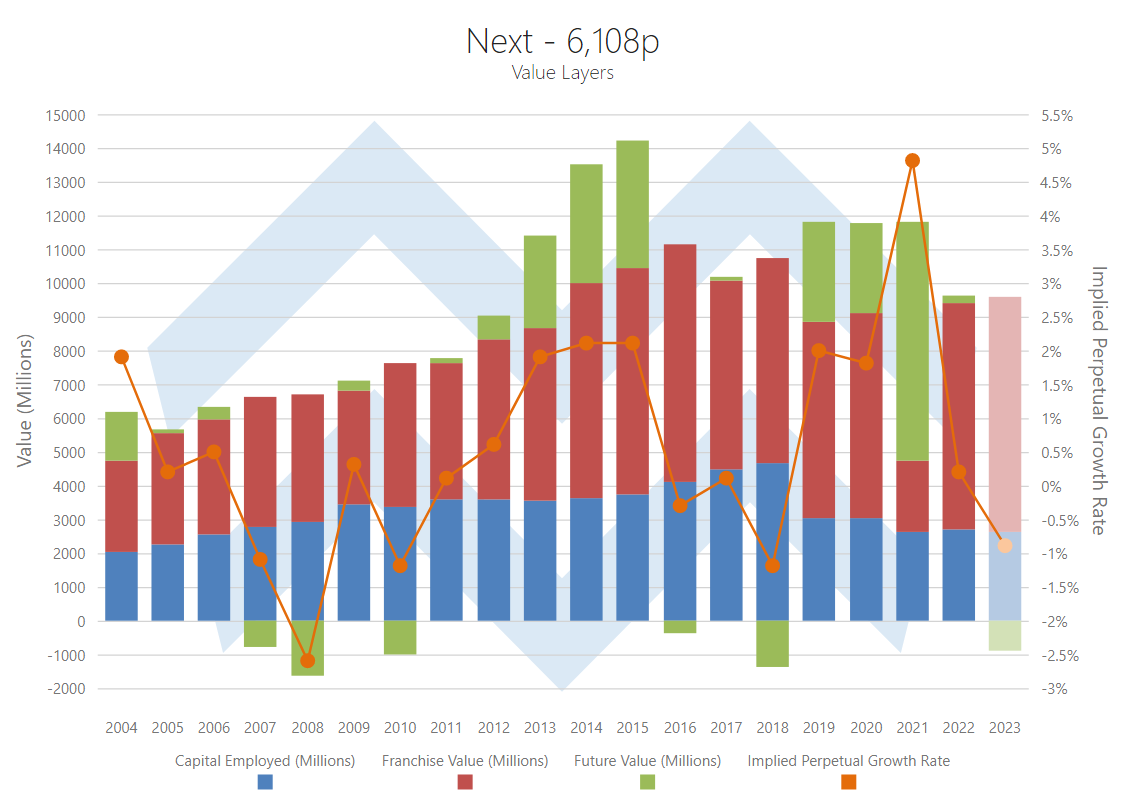
Our Value Layers charts are a graphical illustration of a company’s EVA.
Through our screening options, users can identify stocks which are pricing in little for the future whilst still having a track record of sustained value creation, and vice versa.

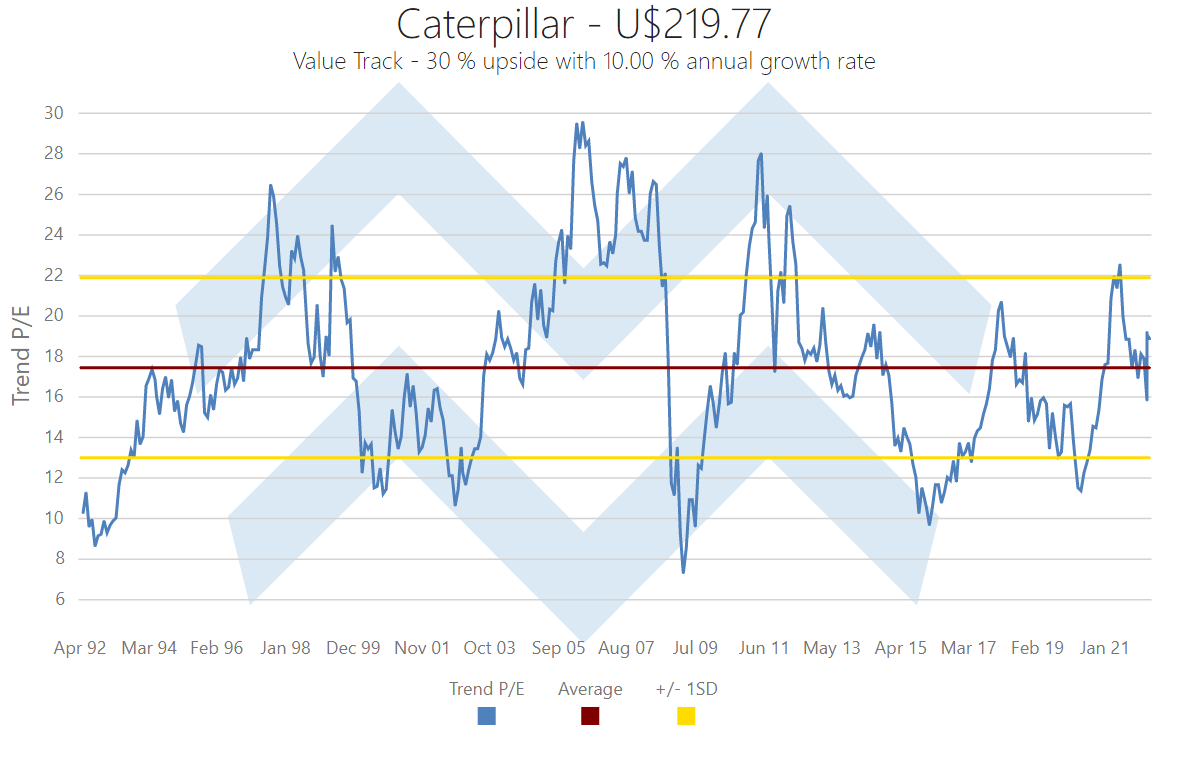
Through Value Track users can assess a company’s valuation through the business cycle.
Value Track charts a company’s PE against “Trend Earnings”, effectively smoothing out cyclical swings. In doing so, Value Track creates an instant snapshot of a company’s current valuation compared to history.

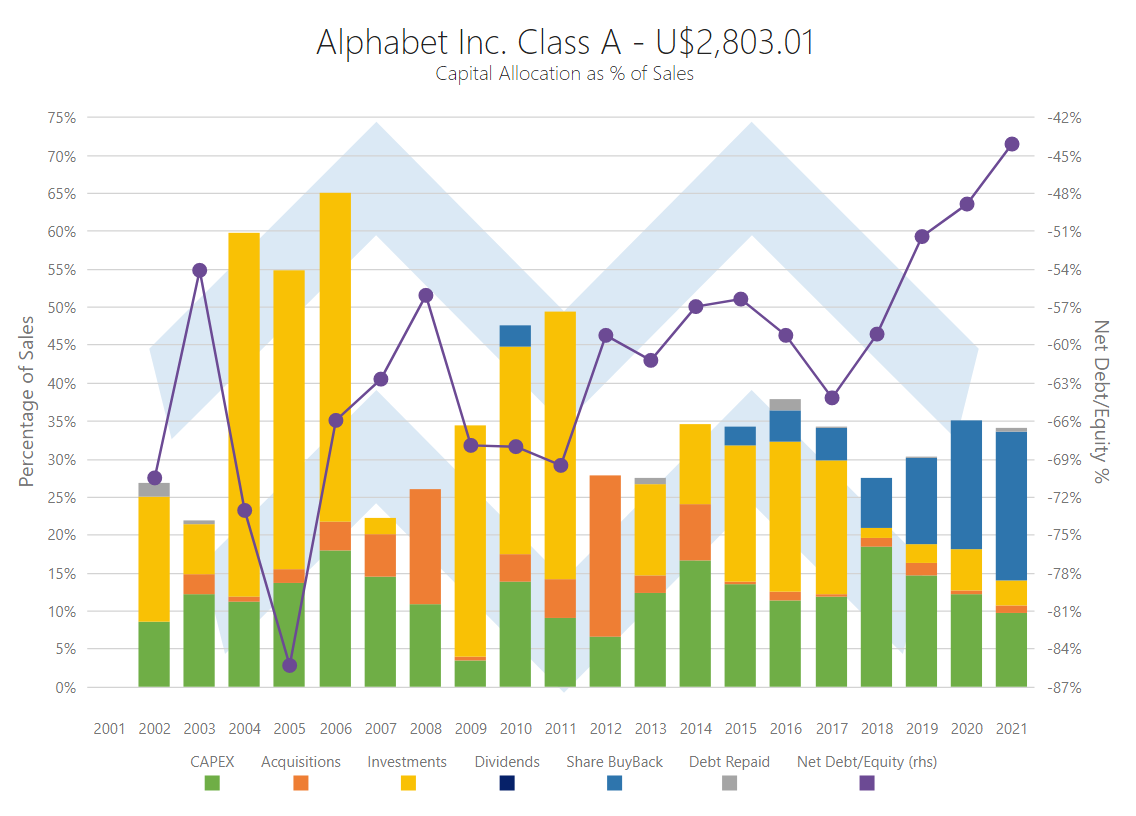
Charts focused on fundamental analysis for each stock in our universe.
The charts enable users to swiftly gain a thorough overview of a company’s ROCE performance, cash generation profile, use of cash, balance sheet strength, cash returns to shareholders and more.
Compass charts are specifically designed to enhance the screening process for the selection of investment opportunities, identifying narratives at stock and sector level and help in the timing of investment decisions.

Supplementing the online screening portal, the Compass team utilise the tool’s powerful screening capabilities in order to compile various pieces of daily, weekly and monthly research pieces.